(Page last updated 2014-02-13. New firmware version 1.08. Modifications/Improvements to USB serial handling, in sync with the Power and SWR Meter project. nanowatts to kilowatts, dBm, volts over 50 ohm – 1, 2.5 or 5 second peak envelope power – average power and amplitude modulation index – in-line (using a power tap) or terminated metering The below is based on a very popular power meter by WZ7OI/W7PUA, described by in QST in June 2001 (Ref: Wes Hayward,W7ZOI, and Bob Larkin, W7PUA, “Simple RF-Power Measurement,” QST, June2001, pages 38-43) The projectdescribed here uses an Atmel AT90USB1286 microcontroller to sample the outputfrom AD8307 logarithmic amplifier from Analog Devices, 200 times per second. This relatively high sampling rateis used to generate various outputs, displayed on a 16x2 Liquid Crystal Display(LCD), and optionally also transmitted to a computer over USB. A RotaryEncoder with a built in Pushbutton is used to navigate the various displays andto access a settings/configuration menu..  Examples of displays selectable byturning the rotary encoder:Thisdisplay indicates power in decibels over 1 milliwatt (dBm). With anamplitude modulation index of 100%, the peak power is four times or 6dB higherthan the average power. It was quite a confidence level boost to notethat the AM index tracks the amplitude modulation levels I dialed into my Fluke6062A signal generator within +/- 1%. 
The meterautomatically scales the output, from picowatts (-70dBm = 100pW) and up tokilowatts if an appropriate external attenuator or power tap is used. Theavg value shows the one second average (average of the last 200measurements). The PEP value indicates the highest value measured withinthe last second. The AM field indicates amplitude modulation index.  
Thisdisplay is useful when evaluating against an oscilloscope reading 
For ananalog meter feeling, there are two bargraph displays   The firstbargraph has a range of 100dB, from -80 to +20dBm. The second one has arange of +/- 8dB, centered to a current reading by pressing the pushbutton. Circuit description:R2, C1, C2and L1 are for frequency response compensation up to 500 MHz, copied from thecircuit description by W7ZOI and W7PUA. The outputof the AD8307 has a +/-0.5dB lowpass response corner frequency of approx10 MHz. C4 at 2.2nF lowers the corner frequency to approx 100kHz. This is adequate to get a ripple free response irrespective of the RF inputfrequency being measured, while retaining the ability to track amplitudemodulation index and peak envelope power with good accuracy. The outputfrom the AD8307 varies from approximately 0.3V at less than -70dBm to 2.5V at15dBm, with a slope of approximately 25mV per dB.  Circuitdiagram Teensy++ isa USB development board available at PJRC.com, containing an AT90USB1286microcontroller running at 16 MHz. The AT90USB1286 has a program memoryof 128 kilobytes and is a bit of an overkill for this project, to date thefirmware only uses about 15% of the available program memory. MCP1541:voltage reference for the built in 10bit analog to digital converter (A/D) inthe microcontroller. 4.096V/1024 is 4mV. 4mV/25mV per dB gives ameasurement resolution of 0.16dB. The rotaryencoder I used is CUI C14D32P-B3, 32 pulses per revolution (ppr) with detentsand a push switch, Digikey 102-1914-ND. A similar Mouser suppliedalternative might be the Bourns EM14A1D-C24-L032N (different pin layout). Any optical (5V compatible) or mechanical 8, 16 or 32 ppr gray code encodershould do, using a built in or external pushbutton switch. The backlit16x2 Liquid Crystal Display (LCD) is of the HD44780 compatible variety. These come for 10 dollars or less on Ebay, postage included. Power isprovided over the USB connector, either from a computer or from a repurposed 5VUSB cell phone charger. The AD8307metering circuit is constructed “dead-bug” fashion on an unetched printedcircuit board, as described in the W7ZOI/W7PUA article, while the Teensy++board sits on two 20 pin single in line sockets, mounted on a stripboardholding the voltage reference, a potentiometer for the LCD contrast and amodest number of capacitors for RF decoupling. Everything is mountedinside a Radioshack utility box, providing RF shielding.  Power meterall boxed up
Rotary Encoder and Pushbuttoncontrol menus:The RotaryEncoder is used to select between the following menus:  The first display is visible for one second, beforeswitching to the second display. The pushbutton is used to centre the +/-8dBBargraph.
A long push is used to enter the Configuration Menus. All configuration settings are stored in EEPROM and are retained when the meteris powered off. Configuration Menus: 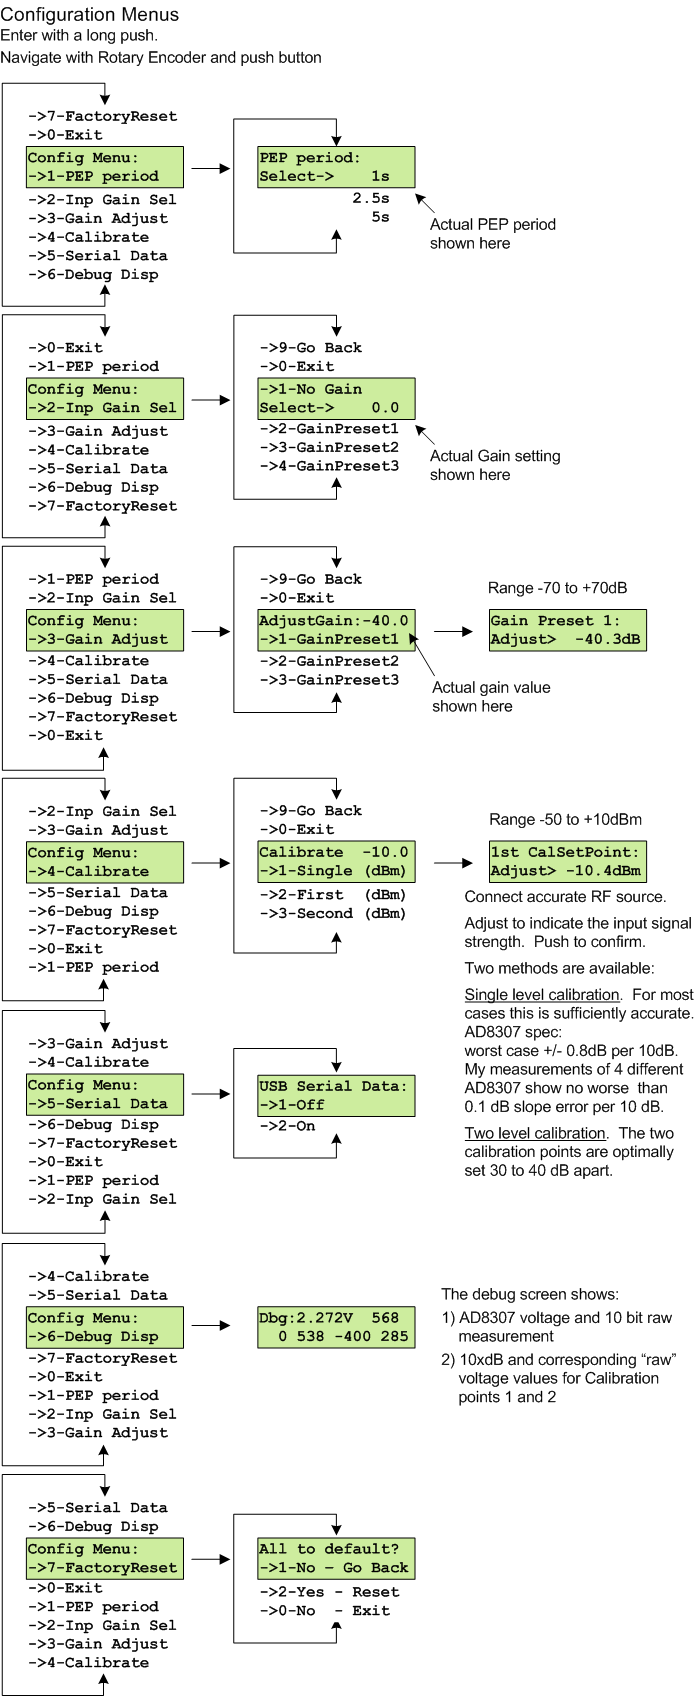
Computer readable data and USB commandsThe following commands are available using the the USB virtual serial port: $ppoll produces an instantaneous power reading in the format:
$pinst, $ppep and $pavg produce a reading of instantaneous, PEP or average (1s) power in human readable form, pW to kW: Exammple: 87.9mW $pinstdb, $ppepdb and $pavgdb produce a reading of instantaneous, PEP or average (1s) power in human readable form, decibel over milliwatt (dBm):
$plong produces a human readable message, example output:
$pcont will trigger continuous mode reporting, 10 times per second. The format reported is the last one selected of the above ($ppoll, $pinst, $ppep, $pavg, $pinstdb, $ppepdb, $pavgdb, $plong). For example the commands:$pinst$pcontwill produce continuous reporting of the instantaneous power. $ppoll, $pinst, $pinstdb, $ppep, $ppepdb, $pavg, $pavgdb or $plong entered while in continuous mode will switch back to single shot mode. $calset cal1 AD1 cal2 AD2
$calget retrieves the calibration values. This is useful if you are playing with the firmware. $encset x x = Rotary Encoder resolution, integer number 1 to 8. Used to decrease Encoder resolution if required. $encget returns current value of Encoder Resolution. $amset x x = minimum signal strength to display Amplitude Modulation information, -80 to 20 dBm (20 dBm effectively turns the function off). $amget returns current signal strength level to display Amplitude Modulation information. $version reports version and date of firmware
The firmware, available here and at the bottom of this webpage, includes full source code and a precompiled binary ready to flash into the microcontroller. Also included is a Windows driver (.inf file), if desiring to enumerate the meter as a serial device by a computer running Microsoft Windows XP, Vista or 7. To flash the firmware into the Teensy++ 2.0 USB development board, a free utility called Teensy Loader is downloaded from the website http://www.pjrc.com. The firmware is programmed in C, using Atmel Studio 6, available for free at the Atmel website (registration is required): http://www.atmel.com/tools/atmelstudio.aspx. The basic functionality of the firmware is to measure the A/D and to calculate the resulting power indication in dB-milliwatt. To do this, all the meter needs is two accurate signal levels, 30 - 40 dB apart, as calibration points. If you build the meter using the same voltage reference and component values in front of the AD8307 as indicated in the diagram above, then I would expect reasonable accuracy with the parameters used by default in the firmware. 200W 40dB Power Tap:A 40dB power tap makes the meter suitable for accurate in-line metering of any power level from approx 1 microwatt to 500 watts
I can hardly think of a better way to adjust and monitor a 1mW WSPR transmitter :)  W7ZOI has a very goodpicture of his build of the Power Tap: http://w7zoi.net/Power%20meter%20updates.pdf. Using 3x 820 ohm 1/2W resistors in series, his power tap can handle up to 75W (~100W) for a short time period, however the resistors will quickly get very very hot. The only difference in my build is the use of 2x 1 kohm and 1x 470 ohm 3W thickfilm resistors (Digikey 989-1194-1-ND and Digikey 989-1211-1-ND), thus raising the power capability up to reasonably comfortable 200W,or momentary levels of ~400W. I use two 100 ohm 1/4W carbon film resistors in parallel to terminate the bottom center connector to ground.  The powertap is built into a Hammond 1590A enclosure The 1 x 1.5inch piece of single sided unetched printed circuit board connects between thetwo topmost BNC connectors, providing a 50 ohm match against the walls of theenclosure. The PCB is cut and filed abit to make room for the corners in the enclosure and the protrusion of theconnectors. When using flange type (BNC,N or UHF) connectors, the sides of the 1x1.5 inch PCB piece do not need to befiled as shown. A UHF connector versionis only good up to approx. 200 MHz. The zig-zagmounting style of the three large resistors reduces the frequency response abit, but the tap is still quite useable up to the 70cm band.  Notice thewire in parallel with the first resistor. This wire is only terminated on one side, to the PCB, and provides alittle capacitive shunt over the resistor to correct for inductive errors inthe UHF frequency range. Here is aVNA Plot of the input SWR and attenuation characteristics of the Power Tap:  Reasonablyaccurate and minimal SWR up to 70cm. At500 MHz and beyond, everything starts falling apart.
To download any of the files below, please click on the down arrow ďat the right hand side of the file. |
